NPV Models
Although NPV can be calculated manually, most NPV forecasts are made by developing a model built using a spreadsheet. The conventional design is to use a table with columns for the different time periods included in the modelled timespan and use rows for the relevant costs and benefits. Calculations can then be aligned under the table.
Simple Example of an NPV Model
This example has been made simple so as to illustrate the basic mechanics of an NPV model and how they cam be implemented in Excel.
The example project has estimated:
- a delivery cost of £2.5m spread evenly over its first two years and
- net benefits of £3.5m to commence midway through the second year and to be sustained at a rate of £1m per annum until the end of the fifth year.
These should be realistic estimates that include unbiased provision for risk. In this case, they have been made at constant rates i.e. without the effects of inflation.
The figure below illustrates how NPV can be modelled assuming a discount rate of D = 4%. This is a relatively low discount rate, suggesting that the associated market risk is low and also reflecting the fact that inflation has not been factored into the costs and benefits.
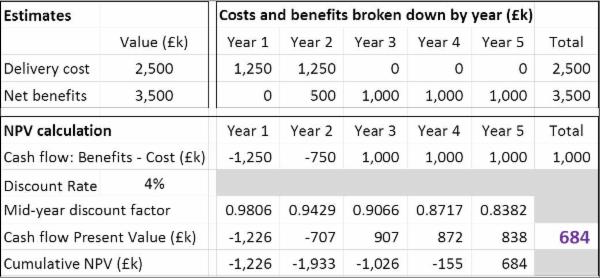
The present value for the cash flow during each year is calculated by multiplying the cash flow by the relevant discount factor.The project NPV of £684k is in purple font in the cell that calculates the sum of the present values of the cash flows for the five years that comprise the modelled timespan.
An Excel file containing this simple model can be downloaded from this link.
Notes
- If discounting had not been applied, the project's net value would have been £1m i.e. £3.5m benefits minus £2.5m costs. The difference between this value of £1m and the NPV of £684k illustrates how much difference discounting can make to the forecasts, even with a low discount rate.
- The inclusion of the cumulative NPV calculations in the lowest line of the model is not essential, but has two advantages. First it provides a check to help prevent spreadsheet design errors. In this case, we can see that the end cumulative NPV matches the primary calculation. Second, it provides an estimate of the payback period i.e. the time by which the cumulative present value of benefits exceeds that of costs. In this case the payback period is approximately 4.2 years.
- This model is based on setting discount factors at mid year points, which is appropriate given the steady nature of costs and benefits profiles. This link illustrates how mid-year discount factors can be calculated in Excel.
- Some models include the effects of inflation on costs and benefits. The inclusion of inflation can become important if different types of cost and/or benefits are subject to different inflation rates. This link provides notes on the relationship between discount rates and inflation.
- In the case of this example, a relatively low discount rate was used. This link provides notes on factors that are used to set discount rates.